
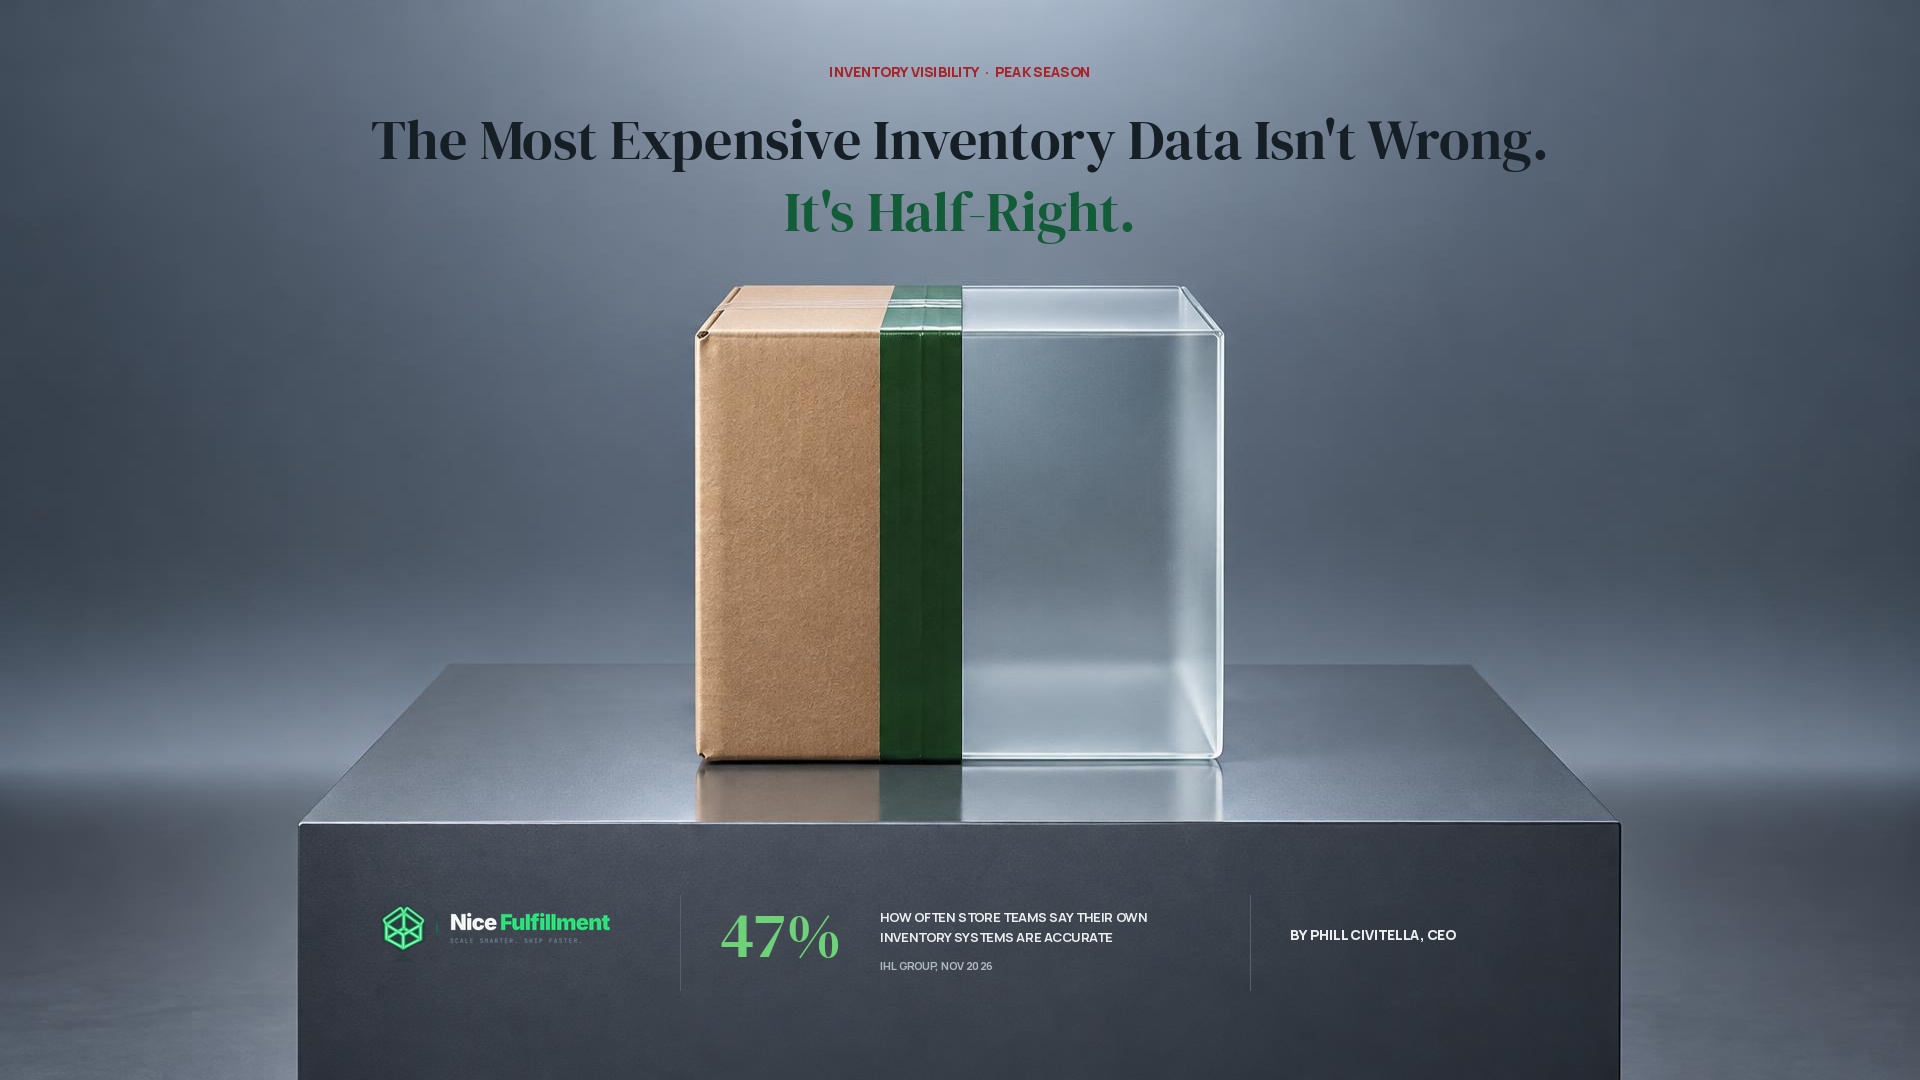
The Most Expensive Inventory Data Isn't Wrong. It's Half-Right.
Half-accurate inventory data costs ecommerce brands more than clearly bad data, because teams can't tell which numbers to trust, so they double-check everything. During peak season, that uncertainty shows up as oversold SKUs, phantom stockouts, and support tickets that didn't need to exist. The fix isn't more data. It's data you can actually trust, visible in real time, down to the SKU and the hub.
The National Retail Federation expects holiday sales to grow 4.2% this year, pushing the season past $1.013 trillion. NRF That's a lot of orders moving through systems that, by most retailers' own admission, don't fully agree with reality.
A November 10, 2026 study from IHL Group, run with Sapio Research and Scandit, surveyed 2,200 store associates across the US, UK, Canada, France, Germany, Italy, and Poland. The associates rated their own inventory systems as accurate about 47% of the time. Call it a coin flip. The researchers, led by Greg Buzek, called the finding "the sometimes right trap," and the real headline wasn't the 47%. It was where the labor losses actually piled up. Not in the worst-performing stores. In the middle ones, where the system is right often enough that nobody fully trusts it and nobody fully ignores it either.
That finding translates directly to ecommerce fulfillment. A brand staring at a dashboard that's usually right isn't in a better position than one staring at a dashboard that's clearly wrong. In some ways, it's in a worse one, because someone still has to find out which number to believe, order by order, SKU by SKU, right when peak volume makes that kind of checking most expensive.

Two ideas worth holding onto before the rest of this.
The visibility tax.
The compounding cost a brand pays, in wasted labor, oversold inventory, and lost customer trust, when it can't see its real inventory position in real time. It's not one bad decision. It's dozens of small ones made on half-right information, every day, all peak season.
Half-accurate data.
Inventory data that is correct often enough to be trusted but wrong often enough that it shouldn't be. IHL Group's research found this middle ground costs more in labor and trust than data that's clearly, consistently wrong, because people keep checking it instead of either trusting it or working around it.
What Does Flying Blind Actually Mean for an Ecommerce Brand During Peak?
In a store, flying blind looks like an associate walking to a shelf that the system says is stocked, finding it empty, and spending the next ten minutes figuring out whether to trust the system or their own eyes. In ecommerce fulfillment, it looks the same, just further from view.
It's a product page showing "in stock" on an item that sold out across hubs six hours ago, because the inventory feed updates on a batch cycle instead of in real time. It's a customer service team promising a ship date based on a number that was accurate yesterday. It's a buyer deciding whether to run a flash sale without knowing, for certain, whether the warehouse can actually cover it.
None of this looks like a crisis in the moment. That's what makes it expensive. A system that's obviously broken gets fixed, or at least gets worked around. A system that's usually right gets trusted just enough to cause damage when it's wrong, which, during peak, is exactly when the cost of being wrong is highest.
Why Does Half-Accurate Data Cost More Than Clearly Bad Data?
This is the part of the IHL Group study worth sitting with. Associates in stores with middle-tier accuracy, roughly 31% to 70% correct, spent 30.4 hours a week on eight routine inventory tasks. Associates in stores with better than 70% accuracy spent 25.9 hours on the same tasks. That's 4.5 extra hours a week spent not because the data was bad, but because it wasn't reliable enough to stop checking.
The breakdown is specific: 3.5 hours a week recounting stock in the middle-accuracy stores versus 2.5 hours in the high-accuracy stores. 3.6 hours a week searching for items the system said were in stock versus 2.6 hours. Suspected theft incidents ran 9.5 a week versus 6.7, likely because unexplained shrinkage is harder to distinguish from bad data when the data itself can't be trusted either way.
Here's the part that should change how a lot of brands think about their own dashboards: only 9% of associates in the most accurate stores said they "completely trust" their stock data, and the ones who did spend 41% more time recounting and 50% more time on expiry markdowns than associates with partial trust. IHL's own read is blunt: "Trust and accuracy are two different measurements." A number can be right and still get double-checked, and a number can be wrong just often enough that everyone treats it as unreliable, which is its own kind of operational drag.
Translate that to a fulfillment operation and the pattern holds. A merchandising team that's been burned by a stale inventory feed doesn't stop checking once the feed improves. It keeps checking, because trust rebuilds slower than accuracy does. That's the real argument for getting visibility right before peak, not during it. Peak season is the worst time to be rebuilding anyone's trust in a number.
What Does Good Visibility Actually Fix?
IHL Group published a second study on November 16, 2026 that's worth reading alongside the first, because it shows what happens when a retailer actually closes the accuracy gap instead of living with it. JD Sports rolled out RFID tracking across every UK and Ireland store, working with Zebra Technologies, Renovotec, and Checkpoint Systems. The rollout started as a five-store pilot, scaled by roughly 26 stores a week, and reached 98% on-shelf availability across 414 stores in about three months.
The operational numbers moved with it: replenishment times fell 20%, and 95% more stock made it from the stockroom to the shop floor instead of sitting uncounted in the back. The headline isn't the technology. It's the sequencing. JD Sports fixed the count first, then everything downstream, replenishment speed, shelf availability, staff time, got faster because the underlying number stopped being a guess.
Fulfillment works the same way. Real-time visibility into on-hand inventory by SKU and by hub, sell-through velocity, and reorder points isn't a dashboard feature. It's the fix for the exact problem IHL's first study measured: a team spending hours a week reconciling a number it shouldn't have to reconcile. That's the thinking behind Glasshouse, Nice Fulfillment's real-time inventory platform, built around the idea that a brand should never be checking its own stock count against a warehouse's memory of it. The full capability set, from landed cost per order to demand forecasting, is covered in that announcement. The point here is narrower: visibility isn't a nice-to-have during peak. It's the thing that determines whether every other peak season decision is made on real information or a guess dressed up as a number.
What Does Flying Blind Cost in Trust, Not Just Time?
Labor hours are the easiest cost to measure, which is probably why they show up first in a study like IHL's. They're not the most expensive one. Inventory blindness shows up to a customer as an oversold item, a delayed shipment, or a tracking page that hasn't moved, and customers don't separate "bad 3PL" from "bad data." They just stop trusting the brand.
Narvar's research on post-purchase experience puts a number on that: 21% of shoppers say they won't order from a brand again after a single delivery failure. Narvar also estimates the direct cost of a delivery issue, refunds, support time, replacement shipping, at $25 to $35 per incident. Multiply that across a peak season's volume and a modest oversell rate becomes a real line item, before anyone accounts for the customer who simply doesn't come back.
Baymard Institute's research on cart abandonment adds the upstream version of the same problem: 40% of shoppers abandon a cart over unexpected extra costs, and 20% abandon because delivery is too slow. Baymard Both of those are often downstream of inventory uncertainty, a shipping promise made on bad data, a delivery window that slips because the order had to be split across hubs nobody flagged in time.
This is the full shape of what we're calling the visibility tax: the labor hours spent double-checking a number that shouldn't need checking, plus the oversells and delays that happen anyway, plus the customers who quietly stop ordering because of it. None of those three costs show up on the same line of a P&L. All three come from the same root cause.
What Does This Actually Look Like From a Brand's Side?
Strip away the research and the term-of-art, and the question a brand is really asking is simpler: does my fulfillment partner tell me what's actually happening, or do I find out after the fact? That's a visibility question and a communication question at the same time, and the two are harder to separate than most vendor comparisons admit.
"Big fan of the Nice Fulfillment team. Excellent communication. They respond quickly and accommodate our needs. We have worked with two other warehouses in the past; Nice Fulfillment is by far the best. For context, we are a fashion jewelry brand."
That's not a review about a dashboard. It's a review about getting a straight answer quickly, which is what real-time visibility is actually for. A platform that shows the right number does nothing if the team behind it doesn't surface the exceptions that matter before they become a customer's problem. The two have to work together: software that makes the data visible, and a team that treats a flagged exception as worth a phone call, not a footnote in next week's report.
What Should a Brand Ask About Inventory Visibility Before Peak Hits?
A handful of direct questions will surface most of the gap between a dashboard that looks fine and one that actually holds up under peak volume:
Check refresh frequency
Ask how often the inventory count actually refreshes, in minutes, not as a marketing phrase like 'real time.'
Check SKU and hub detail
Confirm you can see on-hand inventory by SKU and by hub, not only an aggregate number that hides which location is short.
Check oversell alerts
Ask whether a human is alerted before a SKU oversells across channels, or only after.
Check reorder workflow
Ask who gets notified when a reorder point is hit and how fast that becomes a purchase order.
Check landed cost accuracy
Ask for a real landed cost per order right now, not an estimate built on last quarter's assumptions.
Brands evaluating a 3PL relationship, or auditing their current one, can walk through a fuller version of this in how to choose a 3PL and the broader peak season readiness checklist. The pattern that shows up across all of it is the same one IHL's research points to: the brands that ask these questions before peak starts are the ones that aren't finding out the answers from a customer complaint in December.
"The brands that struggle most during peak aren't the ones with the worst data. They're the ones with data that's just good enough to trust and just wrong enough to cost them. Fixing that gap before peak starts is the highest-leverage thing a brand can do for its margin, and it has nothing to do with working harder."
— Phill Civitella, CEO, Nice Fulfillment
Inventory visibility isn't a feature. It's the precondition for every decision a brand makes in peak season.
We cover the underlying capability — landed cost per order, sell-through velocity, reorder alerts, on-hand by SKU and hub — in the Glasshouse announcement. If the questions in this article don't have clean answers from your current partner, that's the place to start.
Keep reading
- Glasshouse: Real-Time 3PL Inventory Dashboard
- Peak Season Fulfillment Readiness
- How to Choose a 3PL: A Guide for Ecommerce Founders
- What Happens When a TikTok Shop Order Spikes Overnight
Sources
- IHL Group, "The 'Sometimes Right' Trap: Why Half-Accurate Data Costs More Than Bad Data," November 10, 2026
- IHL Group, "98% On-Shelf Availability in 414 Stores. JD Sports Fixed the Count First.," November 16, 2026
- Narvar, post-purchase experience research
- Baymard Institute, "Cart Abandonment Rate Statistics"
- National Retail Federation, 2026 Holiday Sales Forecast
About the author
Phill Civitella is the CEO of Nice Fulfillment, where he has spent 18 years in fulfillment and logistics helping ecommerce brands build supply chains that hold up under real pressure, not just steady-state volume.
Frequently asked.
Q
What does "flying blind" mean in ecommerce fulfillment?
It means making decisions, pricing, promising ship dates, running promotions, based on inventory data that doesn’t reflect what’s actually on the shelf or in the hub right now. It usually doesn’t look dramatic in the moment. It shows up later as an oversold SKU or a shipment that doesn’t go out when promised.
Q
Why does half-accurate inventory data cost more than clearly bad data?
IHL Group’s November 2026 research found that teams working with partially accurate data (roughly 31% to 70% correct) spent more time double-checking and recounting than teams working with either highly accurate or consistently unreliable data. When a number is right often enough to be tempting but wrong often enough to bite, people keep checking it, and that checking is its own cost.
Q
What is "the visibility tax"?
It’s the combined cost a brand pays for not having real-time, accurate inventory visibility: the labor hours spent reconciling numbers, the oversells and delivery delays that happen anyway, and the customers who quietly stop ordering after a bad experience. It rarely shows up as one line item, which is part of why it’s easy to underestimate.
Q
How much does a delivery failure actually cost a brand?
Narvar estimates the direct cost of a single delivery issue, refunds, support time, and replacement shipping, at $25 to $35. Narvar also reports that 21% of shoppers say they won’t order from a brand again after one bad delivery experience, a cost that doesn’t show up on any invoice.
Q
What does good inventory visibility actually fix?
JD Sports’ RFID rollout, covered in IHL Group’s second November 2026 study, reached 98% on-shelf availability across 414 stores in about three months, with replenishment times down 20%. The lesson translates to fulfillment: fixing the accuracy of the underlying count is what makes every downstream process, replenishment, reordering, customer promises, faster and more reliable.
Q
How does Glasshouse address this?
Glasshouse is Nice Fulfillment’s real-time inventory platform, giving brands visibility into on-hand inventory by SKU and hub, sell-through velocity, reorder alerts, and landed cost per order, among other capabilities. The goal is straightforward: a brand should never have to reconcile its own count against a warehouse’s memory of it. Full details are in the Glasshouse announcement.